Nickel has been produced from two very different ores, sulfidic and lateritic. The origin of lateritic ore is mainly in tropical countries such as Indonesia and is mined from several depths below the surface, while sulfidic ore is generally discovered jointly with copper ore and is mined underground.
The demand for nickel production has been increasing recently as nickel is a main component in lithium-ion batteries utilized in electric vehicles. A rapid, accurate, and precise technique is required for the assessment of these ores both in the mining and refining processes.
X-Ray fluorescence spectrometry (XRF) is a strong analytical technique to identify chemical composition in materials with high precision and the least sample preparation. It is a preferred method in process and quality control throughout several industries.
Instrumentation
The Thermo Scientific™ ARL™ QUANT’X EDXRF Spectrometer has been fitted with a Silicon Drift Detector (SDD) and a 50 Watt Rh or Ag target X-Ray tube, which is air cooled with a maximum excitation voltage of 50 kV.
A set of nine primary beam filters have been developed to improve the peak-to-background signals for all elements from F to Am. The 10-position auto-sampler with spinner enables neglected analysis of several samples. Its SDD remains the performance benchmark for all energy-dispersive detectors. The large active area of 30 mm² allows efficient capture of characteristic element X-Rays discharged by the sample.
Excitation Conditions
As far as EDXRF is concerned, sensitivity and accuracy are obtained by targeted excitation of the sample to fluoresce only the elements of interest. The ARL QUANT’X EDXRF Spectrometer provides a virtually limitless combination of excitation voltages (4 to 50 kV) and several main beam filters for optimal background control.
As displayed in Table 1, spectra were gathered on every nickel ore sample for a total live time of 5 minutes. Measurement time could be fine-tuned as per the specific applications. The analysis is performed in the air.
Table 1. Analytical conditions. Source: Thermo Scientific-Chemical Analysis-Spectroscopy Solutions
| Condition |
Voltage |
Tube Filter |
Medium |
Live Time (s) |
Elements |
| Low Za |
4 |
No Filter |
Air |
180 |
Mg, Al, Si |
| Low Zb |
8 |
C Thick |
Air |
60 |
S, Ca, K |
| Mid Za |
16 |
Ag Thin |
Air |
60 |
Ti, Cr, Mn, Fe, Co, Ni, Cu, Zn |
Sample Preparation
Calibration was performed with the help of 17 nickel ore Certified Reference Materials (CRM) from OREAS®. Samples were made to press into pellets without binder at around 20 tons. Table 2 displays the concentration ranges of the various oxides covered by the calibration and the R² and RMSE (root mean square error) values achieved for the various compounds.
Table 2. Concentration ranges and calibration parameter values for the analysis of nickel ore. Source: Thermo Scientific-Chemical Analysis-Spectroscopy Solutions
| Element |
Min % |
Max % |
R2 |
RMSE |
| MgO |
0.7 |
27.3 |
0.9986 |
0.4 |
| Al2O3 |
1.6 |
17.5 |
0.9985 |
0.2 |
| SiO2 |
22.8 |
48.0 |
0.9896 |
0.8 |
| SO3 |
0.03 |
0.19 |
0.9897 |
0.007 |
| K2O |
0.069 |
0.228 |
0.9935 |
0.006 |
| CaO |
0.13 |
3.11 |
0.9995 |
0.019 |
| TiO2 |
0.02 |
1.36 |
0.9998 |
0.003 |
| Cr2O3 |
0.17 |
1.75 |
0.9971 |
0.02 |
| MnO |
0.11 |
1.94 |
0.9997 |
0.008 |
| Fe2O3 |
12.7 |
46.0 |
0.9986 |
0.4 |
| Co |
0.023 |
0.090 |
0.9839 |
0.003 |
| Ni |
0.05 |
2.94 |
0.9993 |
0.02 |
| Cu |
0.007 |
0.05 |
0.9999 |
0.00014 |
| Zn |
0.007 |
0.035 |
0.9968 |
0.0005 |
Calibration
Calibration curves have been derived concerning element characteristic X-Ray intensity to oxide concentration. X-Ray fluorescence quantifies elements, but the outcomes could be related directly to the oxide forms of such elements when only one single form of oxide is present in the sample. Figures 1 to 14 display the calculated versus provided concentration plots achieved for Ni, MgO, Al₂O₃, SiO₂, SO₃, K₂O, CaO, TiO₂, Cr₂O₃, MnO, Fe₂O₃, Co, Cu, and Zn.
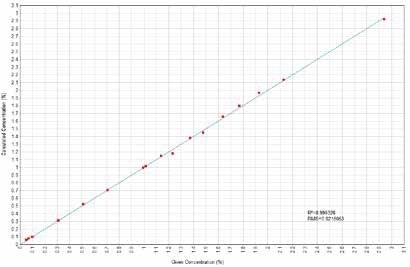
Figure 1. Ni Calculated versus Given Concentrations. Image Credit: Thermo Scientific-Chemical Analysis-Spectroscopy Solutions
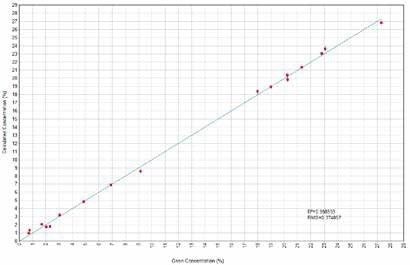
Figure 2. MgO Calculated versus Given Concentrations. Image Credit: Thermo Scientific-Chemical Analysis-Spectroscopy Solutions
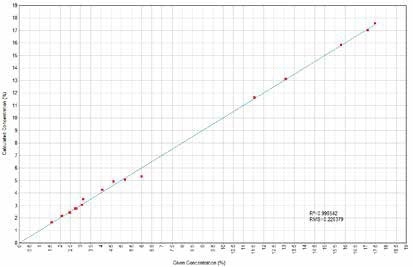
Figure 3. Al2O3 Calculated versus Given Concentrations. Image Credit: Thermo Scientific-Chemical Analysis-Spectroscopy Solutions
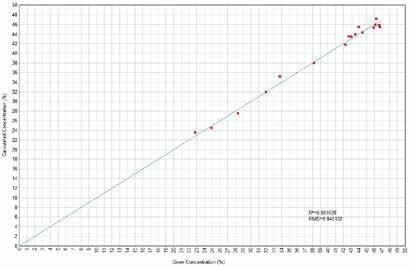
Figure 4. SiO2 Calculated versus Given Concentrations. Image Credit: Thermo Scientific-Chemical Analysis-Spectroscopy Solutions
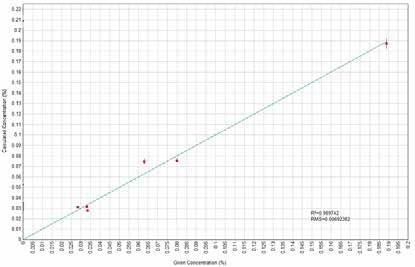
Figure 5. SO3 Calculated versus Given Concentrations. Image Credit: Thermo Scientific-Chemical Analysis-Spectroscopy Solutions
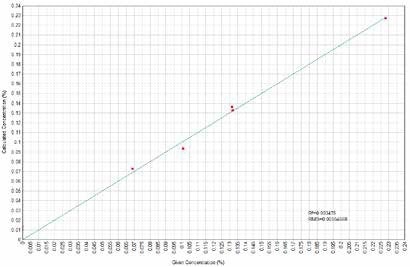
Figure 6. K2O Calculated versus Given Concentrations. Image Credit: Thermo Scientific-Chemical Analysis-Spectroscopy Solutions
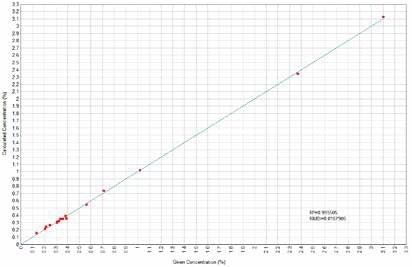
Figure 7. CaO Calculated versus Given Concentrations. Image Credit: Thermo Scientific-Chemical Analysis-Spectroscopy Solutions
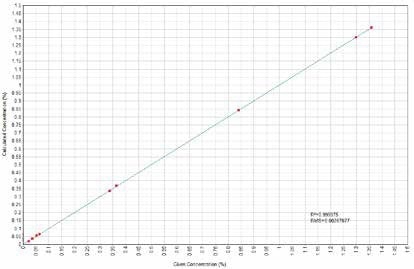
Figure 8. TiO2 Calculated versus Given Concentrations. Image Credit: Thermo Scientific-Chemical Analysis-Spectroscopy Solutions
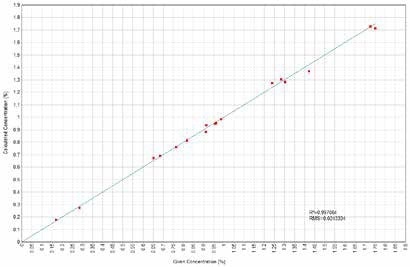
Figure 9. Cr2O3 Calculated versus Given Concentrations. Image Credit: Thermo Scientific-Chemical Analysis-Spectroscopy Solutions
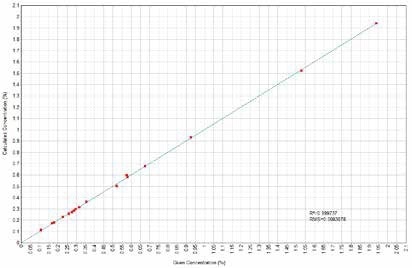
Figure 10. MnO Calculated versus Given Concentrations. Image Credit: Thermo Scientific-Chemical Analysis-Spectroscopy Solutions
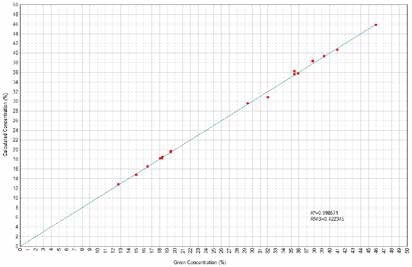
Figure 11. Fe2O3 Calculated versus Given Concentrations. Image Credit: Thermo Scientific-Chemical Analysis-Spectroscopy Solutions
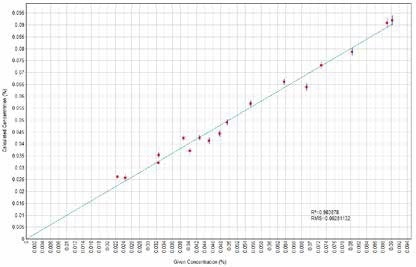
Figure 12. Co Calculated versus Given Concentrations. Image Credit: Thermo Scientific-Chemical Analysis-Spectroscopy Solutions

Figure 13. Cu Calculated versus Given Concentrations. Image Credit: Thermo Scientific-Chemical Analysis-Spectroscopy Solutions
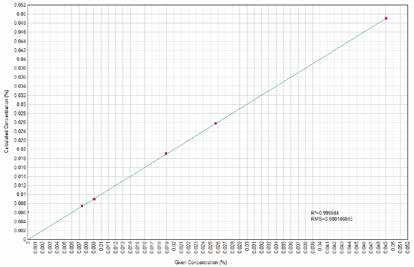
Figure 14. Zn Calculated versus Given Concentrations. Image Credit: Thermo Scientific-Chemical Analysis-Spectroscopy Solutions
Validation
Two nickel ore reference materials (192 and 199) were utilized to validate the calibration. Table 3 displays the analysis outcomes for such reference materials. CRM reference values are made to compare with the average of 10 replicate analyses of the two CRMs while Tables 4a and 4b display the repeatability outcomes for every CRM.
Table 3. Accuracy of results for standards 192 and 199 using ARL QUANT’X Spectrometer. Source: Thermo Scientific-Chemical Analysis-Spectroscopy Solutions
| |
MgO
% |
Al2O3
% |
SiO2
% |
SO3
% |
K2O
% |
CaO
% |
TiO2
% |
Cr2O3
% |
MnO
% |
Fe2O3
% |
Co
% |
Ni
% |
Cu
% |
Zn
% |
| 192 Reference |
21.32 |
2.76 |
43.58 |
- |
- |
0.313 |
0.036 |
0.9129 |
0.277 |
18.1 |
0.0404 |
1.77 |
- |
0.0176 |
| 192 Analysis |
21.86 |
2.61 |
43.97 |
0.03 |
0.0104 |
0.308 |
0.034 |
0.8854 |
0.269 |
18.2 |
0.0376 |
1.80 |
0.0060 |
0.0164 |
| 199 Reference |
0.742 |
17.47 |
24.93 |
0.08 |
0.069 |
0.208 |
0.842 |
0.686 |
1.94 |
41.01 |
0.0554 |
0.0995 |
0.0189 |
0.0198 |
| 199 Analysis |
0.880 |
17.94 |
24.58 |
0.07 |
0.0724 |
0.213 |
0.840 |
0.695 |
1.95 |
40.68 |
0.0566 |
0.0984 |
0.0189 |
0.0206 |
Table 4a. Repeatability results for standards 192 using ARL QUANT’X Spectrometer. Source: Thermo Scientific-Chemical Analysis-Spectroscopy Solutions
| |
MgO
% |
Al2O3
% |
SiO2
% |
SO3
% |
K2O
% |
CaO
% |
TiO2
% |
Cr2O3
% |
MnO
% |
Fe2O3
% |
Co
% |
Ni
% |
Cu
% |
Zn
% |
| Repeats 01 |
21.853 |
2.574 |
44.171 |
0.032 |
0.0104 |
0.307 |
0.034 |
0.885 |
0.269 |
18.187 |
0.036 |
1.803 |
0.0060 |
0.0164 |
| Repeats 02 |
21.992 |
2.565 |
43.843 |
0.031 |
0.0104 |
0.309 |
0.032 |
0.882 |
0.266 |
18.175 |
0.038 |
1.803 |
0.0060 |
0.0158 |
| Repeats 03 |
21.785 |
2.633 |
44.018 |
0.032 |
0.0104 |
0.307 |
0.034 |
0.886 |
0.268 |
18.174 |
0.039 |
1.802 |
0.0060 |
0.0164 |
| Repeats 04 |
21.843 |
2.625 |
43.916 |
0.029 |
0.0104 |
0.308 |
0.033 |
0.886 |
0.270 |
18.202 |
0.037 |
1.800 |
0.0060 |
0.0164 |
| Repeats 05 |
21.448 |
2.712 |
44.334 |
0.033 |
0.0104 |
0.308 |
0.038 |
0.886 |
0.270 |
18.209 |
0.036 |
1.807 |
0.0060 |
0.0167 |
| Repeats 06 |
21.950 |
2.589 |
43.882 |
0.032 |
0.0104 |
0.307 |
0.034 |
0.888 |
0.268 |
18.188 |
0.037 |
1.800 |
0.0060 |
0.0162 |
| Repeats 07 |
21.901 |
2.607 |
43.973 |
0.030 |
0.0104 |
0.307 |
0.030 |
0.886 |
0.270 |
18.173 |
0.039 |
1.804 |
0.0060 |
0.0167 |
| Repeats 08 |
21.958 |
2.586 |
43.913 |
0.028 |
0.0104 |
0.306 |
0.034 |
0.886 |
0.270 |
18.199 |
0.038 |
1.803 |
0.0060 |
0.0165 |
| Repeats 09 |
21.950 |
2.626 |
43.707 |
0.031 |
0.0104 |
0.308 |
0.038 |
0.888 |
0.269 |
18.185 |
0.038 |
1.802 |
0.0060 |
0.0163 |
| Repeats 10 |
21.964 |
2.581 |
43.964 |
0.030 |
0.0104 |
0.310 |
0.035 |
0.882 |
0.271 |
18.198 |
0.040 |
1.804 |
0.0060 |
0.0166 |
| |
|
|
|
|
|
|
|
|
|
|
|
|
|
|
| Average |
21.864 |
2.610 |
43.972 |
0.031 |
0.0104 |
0.308 |
0.034 |
0.885 |
0.269 |
18.189 |
0.038 |
1.803 |
0.0060 |
0.0164 |
| 1-Sigma |
0.160 |
0.043 |
0.175 |
0.002 |
- |
0.001 |
0.002 |
0.002 |
0.001 |
0.013 |
0.001 |
0.002 |
- |
0.0003 |
| % RSD |
0.73 |
1.65 |
0.40 |
4.86 |
- |
0.32 |
6.95 |
0.23 |
0.51 |
0.07 |
3.34 |
0.12 |
- |
1.62 |
| Minimum |
21.448 |
2.565 |
43.707 |
0.028 |
0.0104 |
0.306 |
0.030 |
0.882 |
0.266 |
18.173 |
0.036 |
1.800 |
0.0060 |
0.0158 |
| Maximum |
21.992 |
2.712 |
44.334 |
0.033 |
0.0104 |
0.310 |
0.038 |
0.888 |
0.271 |
18.209 |
0.040 |
1.807 |
0.0060 |
0.0167 |
Table 4b. Repeatability results for standards 199 using ARL QUANT’X Spectrometer. Source: Thermo Scientific-Chemical Analysis-Spectroscopy Solutions
| |
MgO
% |
Al2O3
% |
SiO2
% |
SO3
% |
K2O
% |
CaO
% |
TiO2
% |
Cr2O3
% |
MnO
% |
Fe2O3
% |
Co
% |
Ni
% |
Cu
% |
Zn
% |
| Repeats 01 |
1.009 |
17.750 |
24.609 |
0.069 |
0.074 |
0.213 |
0.845 |
0.696 |
1.943 |
40.653 |
0.056 |
0.098 |
0.0191 |
0.0212 |
| Repeats 02 |
1.053 |
17.755 |
24.563 |
0.073 |
0.071 |
0.213 |
0.839 |
0.693 |
1.945 |
40.680 |
0.058 |
0.099 |
0.0192 |
0.0205 |
| Repeats 03 |
0.981 |
17.827 |
24.559 |
0.077 |
0.073 |
0.215 |
0.847 |
0.694 |
1.942 |
40.698 |
0.056 |
0.098 |
0.0190 |
0.0209 |
| Repeats 04 |
0.773 |
18.055 |
24.612 |
0.074 |
0.073 |
0.213 |
0.838 |
0.694 |
1.950 |
40.683 |
0.057 |
0.099 |
0.0186 |
0.0208 |
| Repeats 05 |
0.887 |
17.903 |
24.685 |
0.074 |
0.073 |
0.214 |
0.841 |
0.690 |
1.950 |
40.651 |
0.058 |
0.098 |
0.0189 |
0.0208 |
| Repeats 06 |
1.203 |
17.767 |
24.359 |
0.073 |
0.071 |
0.213 |
0.838 |
0.697 |
1.940 |
40.669 |
0.055 |
0.098 |
0.0188 |
0.0196 |
| Repeats 07 |
1.024 |
17.885 |
24.488 |
0.078 |
0.074 |
0.211 |
0.848 |
0.690 |
1.939 |
40.656 |
0.057 |
0.098 |
0.0190 |
0.0209 |
| Repeats 08 |
0.389 |
18.263 |
24.756 |
0.074 |
0.073 |
0.213 |
0.836 |
0.698 |
1.953 |
40.693 |
0.058 |
0.099 |
0.0188 |
0.0202 |
| Repeats 09 |
0.746 |
18.160 |
24.516 |
0.076 |
0.072 |
0.215 |
0.835 |
0.699 |
1.941 |
40.687 |
0.055 |
0.099 |
0.0190 |
0.0210 |
| Repeats 10 |
0.737 |
18.040 |
24.614 |
0.075 |
0.071 |
0.213 |
0.836 |
0.695 |
1.948 |
40.688 |
0.058 |
0.098 |
0.0186 |
0.0204 |
| |
|
|
|
|
|
|
|
|
|
|
|
|
|
|
| Average |
0.880 |
17.941 |
24.576 |
0.074 |
0.072 |
0.213 |
0.840 |
0.695 |
1.945 |
40.676 |
0.057 |
0.098 |
0.0189 |
0.0206 |
| 1-Sigma |
0.229 |
0.181 |
0.109 |
0.002 |
0.001 |
0.001 |
0.005 |
0.003 |
0.005 |
0.017 |
0.001 |
0.001 |
0.0002 |
0.0005 |
| % RSD |
26.03 |
1.01 |
0.44 |
3.28 |
1.56 |
0.49 |
0.56 |
0.43 |
0.25 |
0.04 |
2.29 |
0.62 |
1.06 |
2.27 |
| Minimum |
0.389 |
17.750 |
24.359 |
0.069 |
0.071 |
0.211 |
0.835 |
0.690 |
1.939 |
40.651 |
0.055 |
0.098 |
0.0186 |
0.0196 |
| Maximum |
1.203 |
18.263 |
24.756 |
0.078 |
0.074 |
0.215 |
0.848 |
0.699 |
1.953 |
40.698 |
0.058 |
0.099 |
0.0192 |
0.0212 |
Conclusion
This article discusses the suitability of the ARL QUANT’X EDXRF spectrometer for studying nickel ores samples.
This compact instrument enables quick and trustworthy analysis of nickel ores. Precision and repeatability outcomes show that satisfactory results are achievable for an analysis of pressed powders in air. This is a considerable benefit for nickel ore mines which frequently tend to function in remote areas.

This information has been sourced, reviewed and adapted from materials provided by Thermo Fisher Scientific - Elemental Analyzers and Phase Analyzers.
For more information on this source, please visit Thermo Fisher Scientific - Elemental Analyzers and Phase Analyzers.