Quickly present data with Miro’s graph maker
Create charts that resonate with Miro’s online graph maker. Bring a common understanding to teams, present your ideas with great data visualization, and move projects forward.

Over 60M users love Miro.
Create charts quickly
Use Miro apps like the Org chart builder and SmartDiagram app to automatically generate editable organization charts from a CSV file.

Influence decision-making
Extract all charts from a single dashboard or just the charts you need, using data from integrated tools like Amplitude, Grafana, Looker, Tableau and more.
Limitless design features
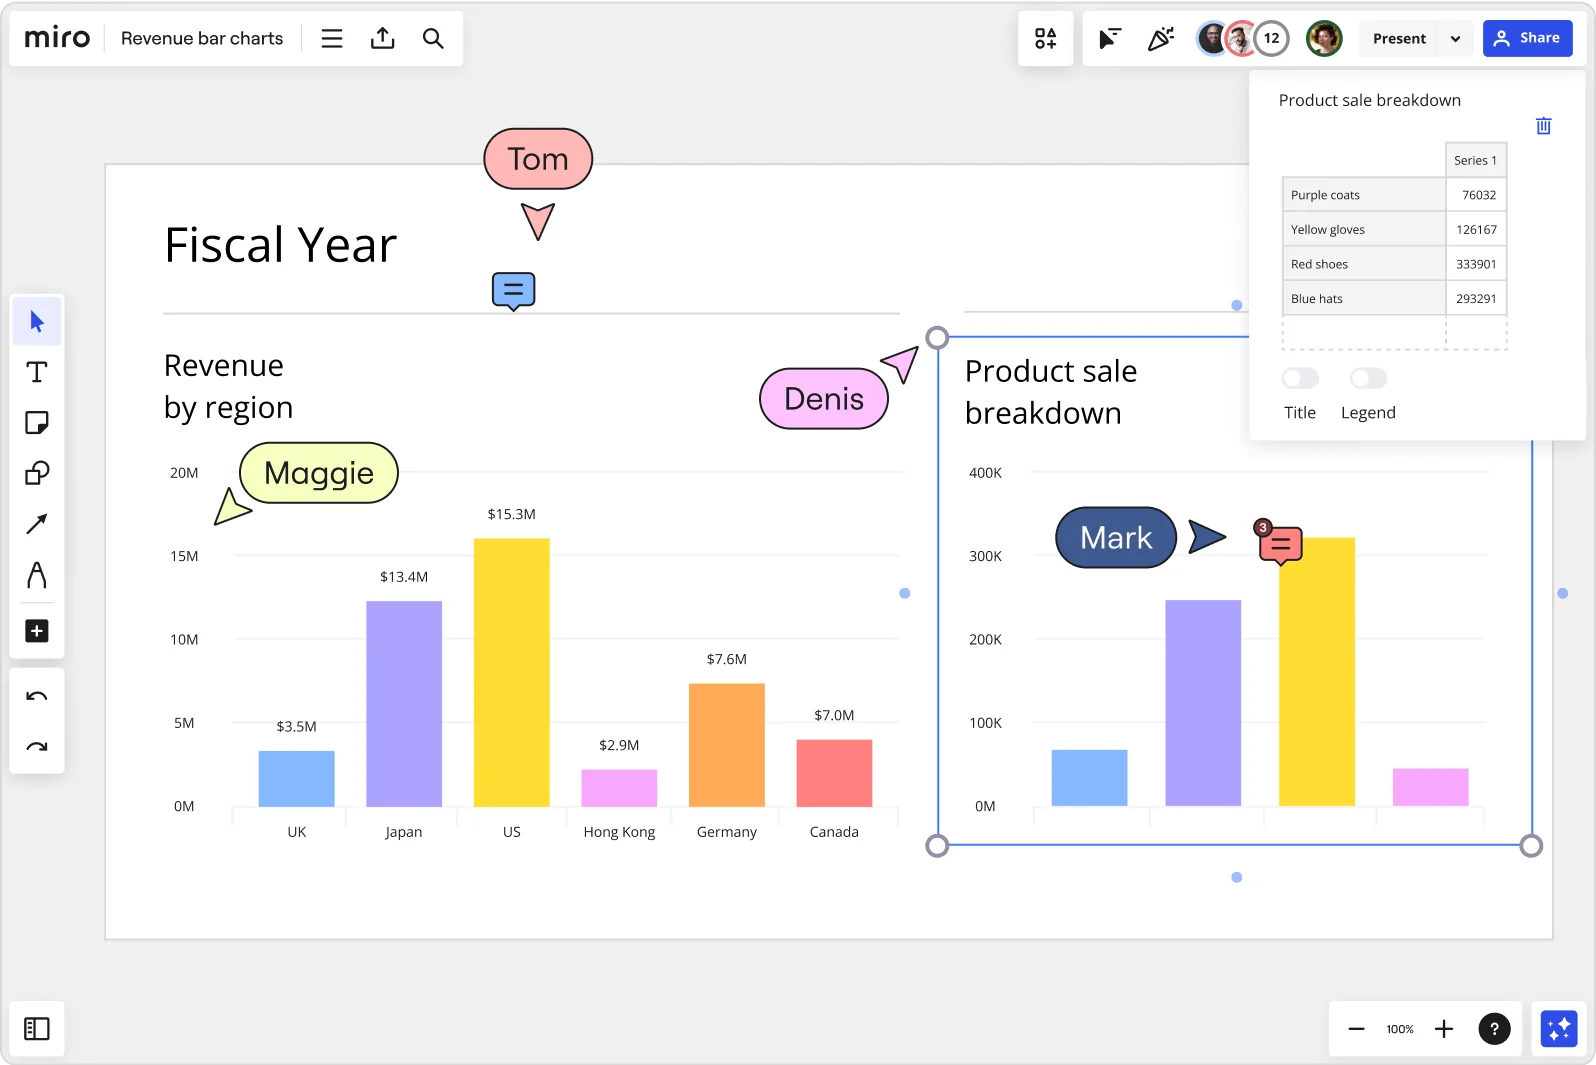
Give better presentations with charts you can style and make yours. Easily edit labels and titles in our built-in graph creator, or add multiple variables contrasting data more visibly.
Why Miro is your best graph maker
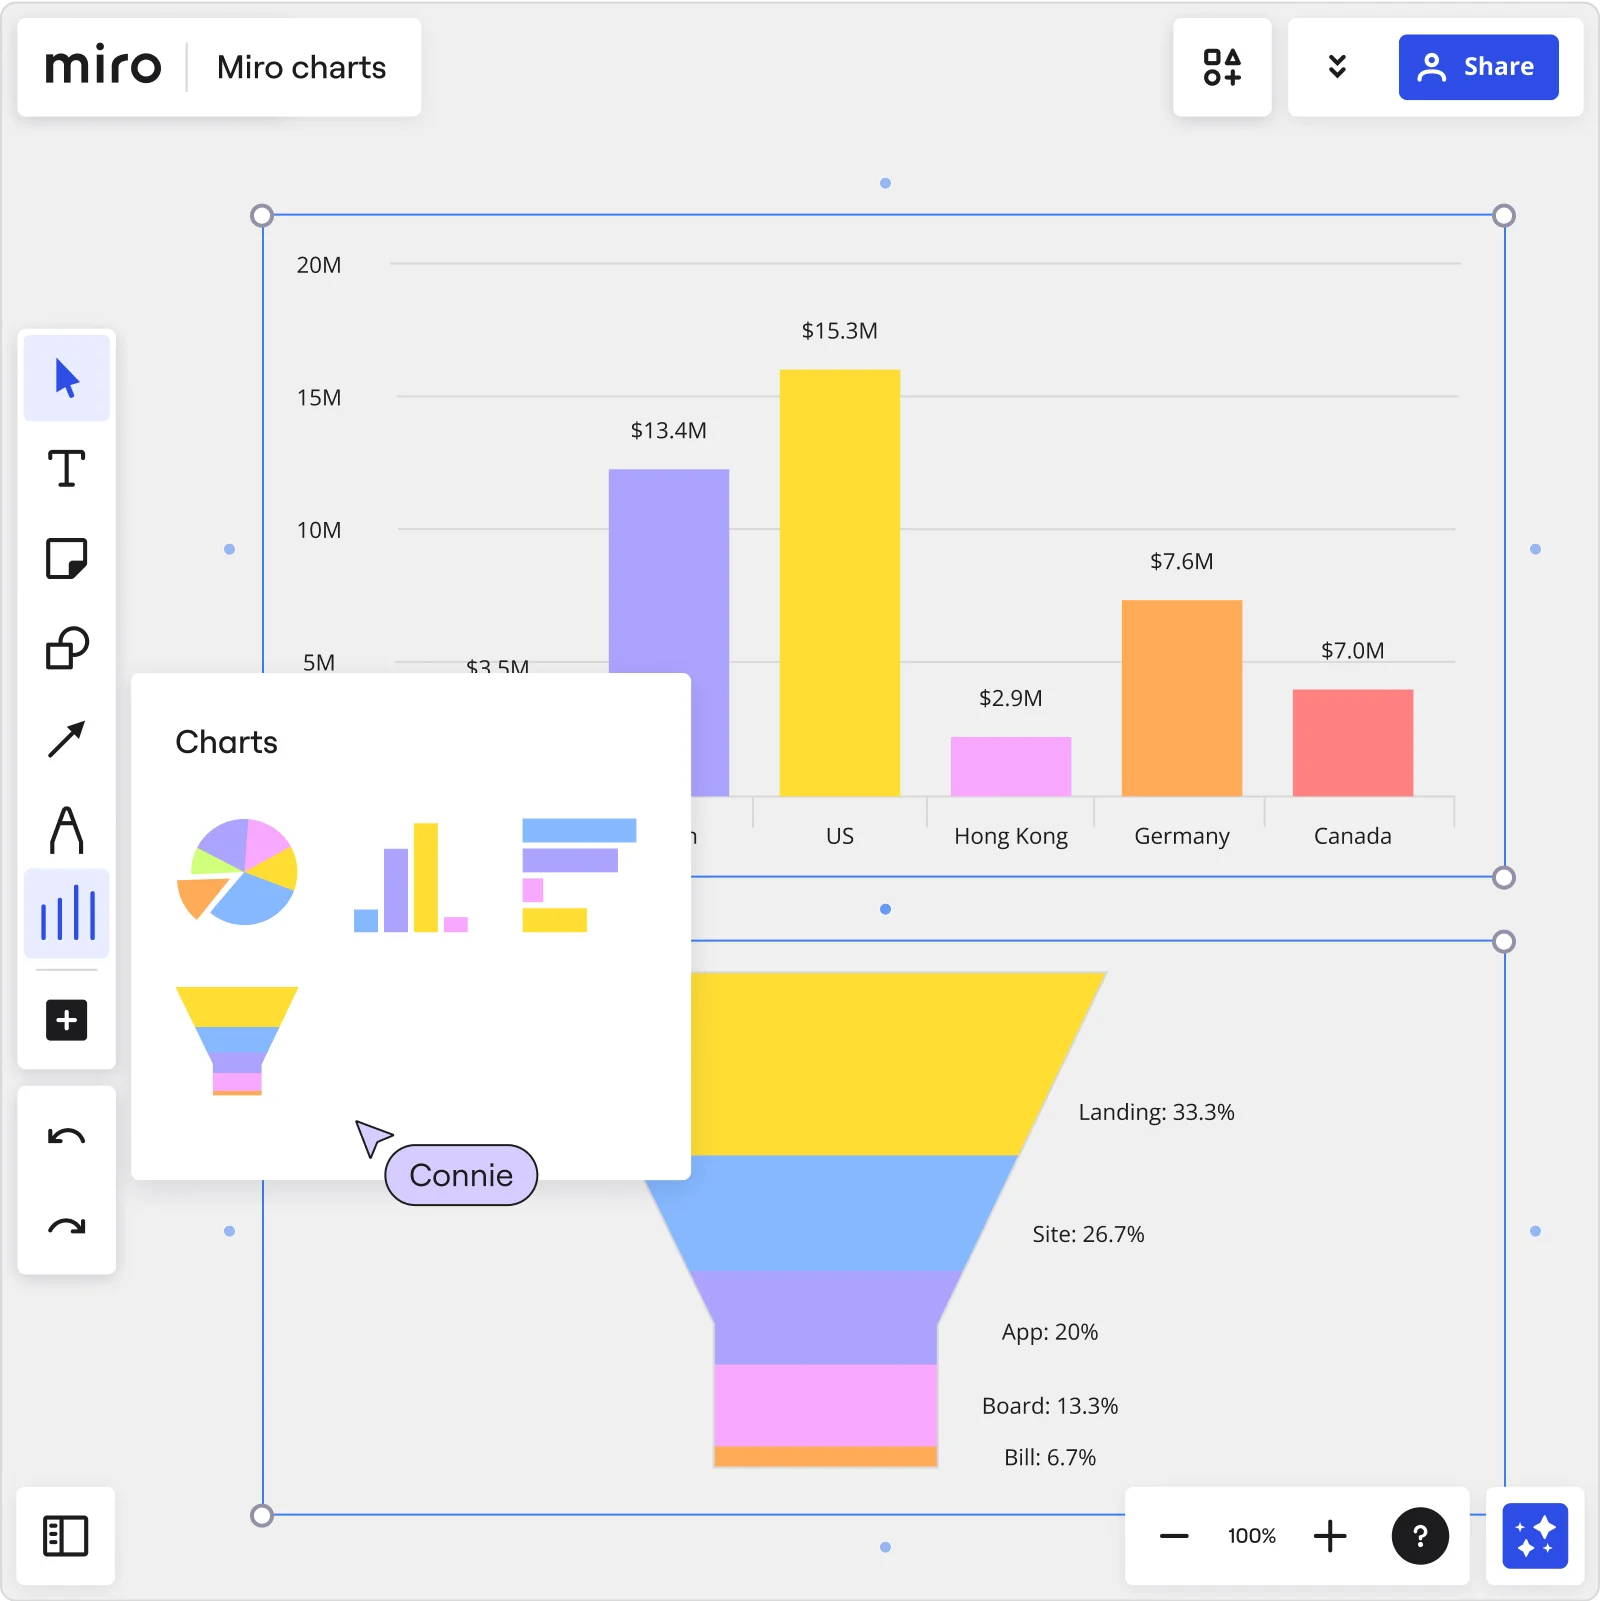
Create charts at ease
Save time with Miro’s built-in chart maker and create a chart with just a few clicks. Miro’s Chart app allows you to create a graph fast, with no previous experience.
Present data in a way that matters
Use Miro’s robust editing features and master your data storytelling. Get inspired by our extensive Templates Library or browse our Miroverse community to create your chart.
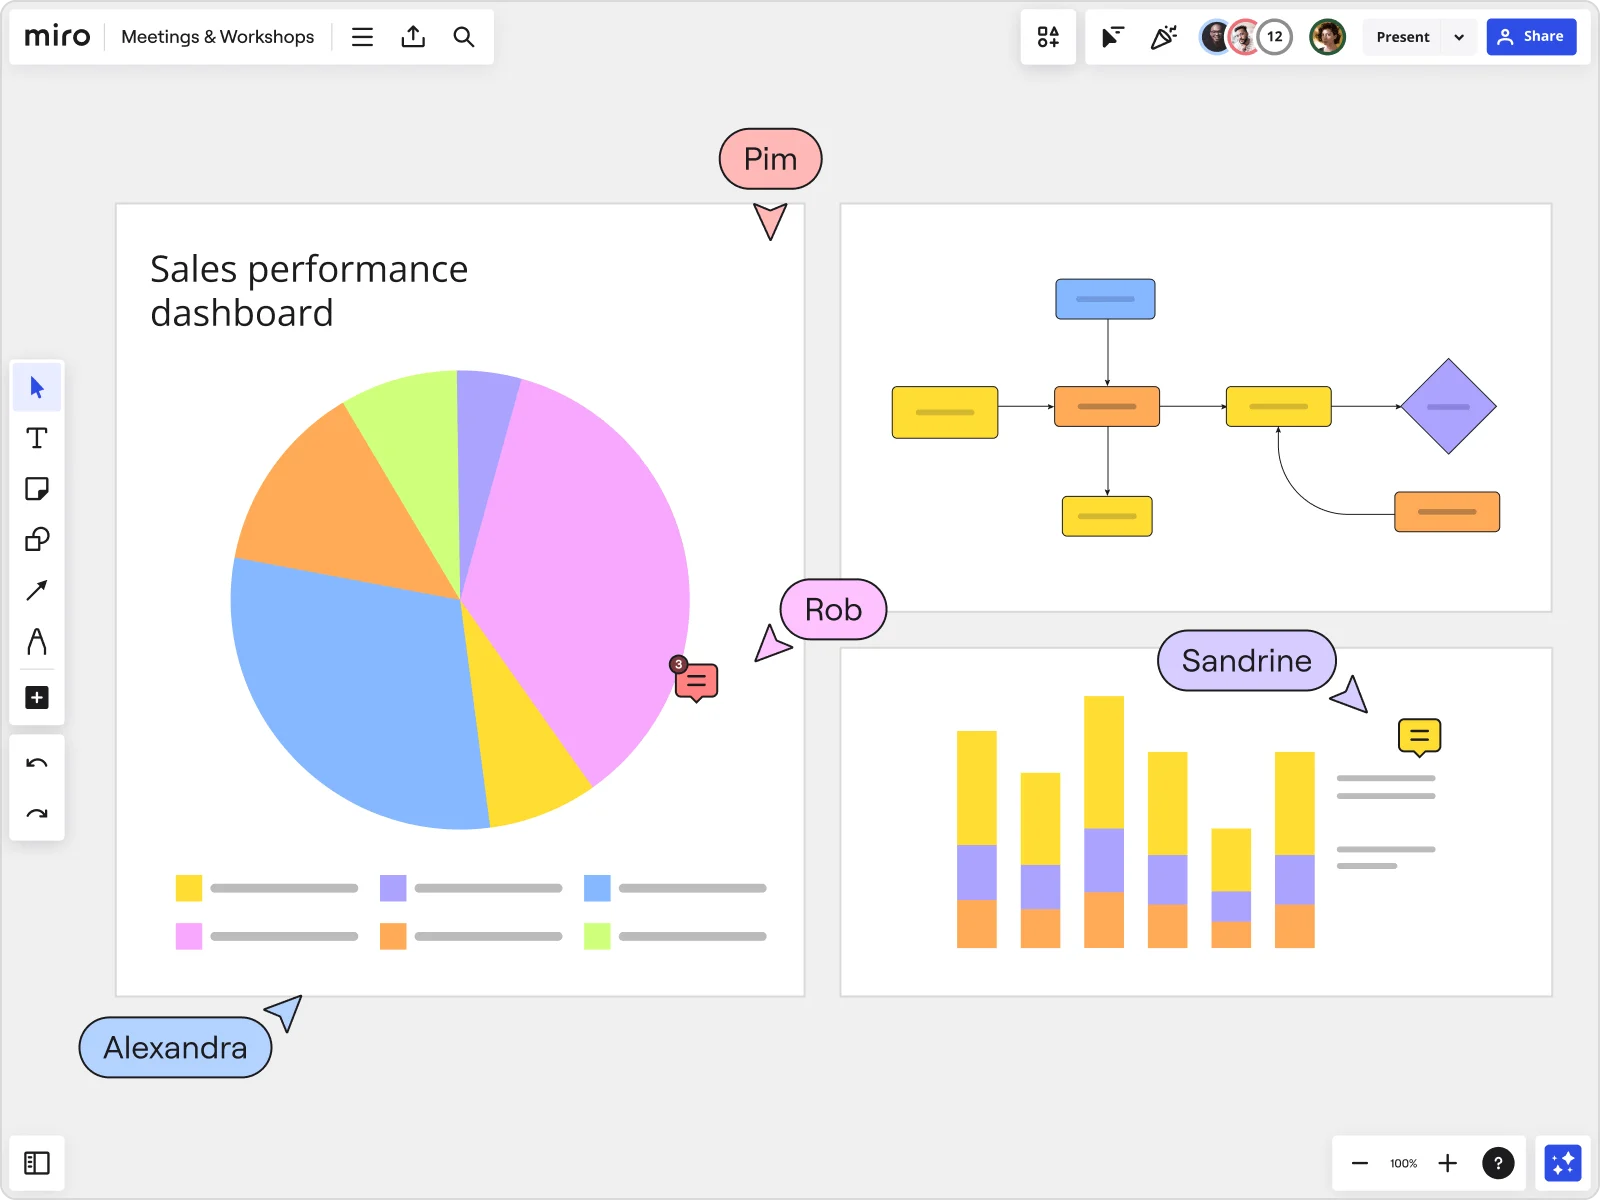
Collaborate and co-create
Miro’s collaborative features make it easier for you to work with others. Tag team members directly on your board, get instant feedback, and invite them to co-create your graphs with you.
Data visualization that works
Make your own chart in minutes with Miro’s built-in chart maker. From strategists to business analysts, you don’t need to be a designer to create amazing-looking graphs.
Related templates
Spot differences between ideas or products and make confident and informed decisions.
Present relationships between datasets and see contrast right away.
Compare different types of categories and datasets visually.
Map out relationships and connections between different ideas, subjects, and elements.
Visually understand the relationships, similarities, and differences between groups using our fully customizable Venn Diagram Template.
Explain any process where many inputs narrow to a single point.
More than a graph maker
Communicate systems, processes, and ideas as a team no matter where you’re working. With Miro, co-creation is a cinch.


Presentations
Give better presentations and visually communicate your ideas, projects, and everything you need. Miro’s online presentation maker helps you to gain the confidence to keep the momentum going.
Learn More
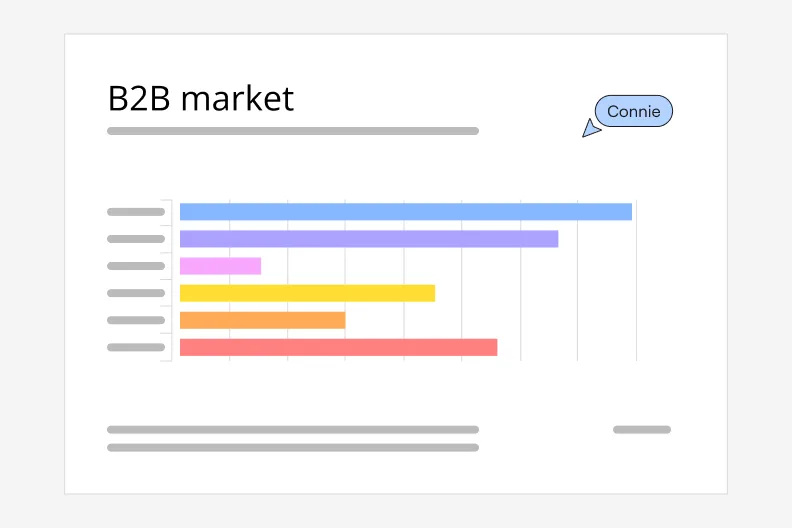
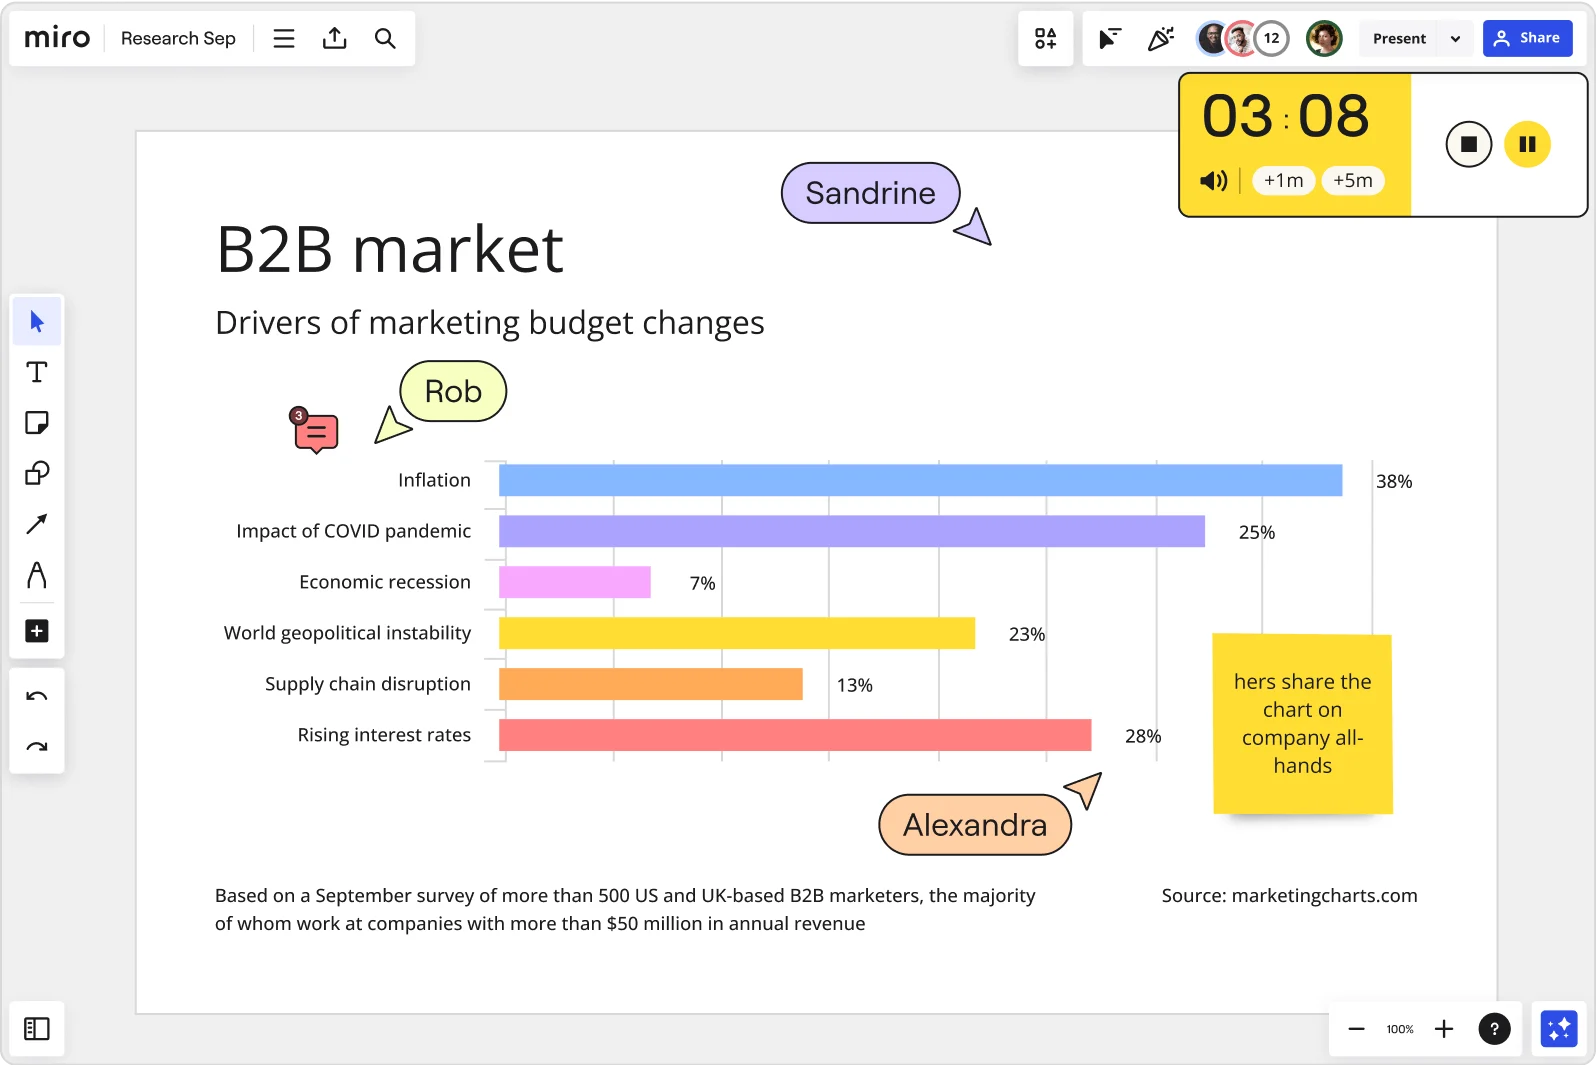
Bar chart maker
Miro’s built-in bar chart saves you time and effort when presenting data, allowing you to create a bar chart in minutes. Improve presentations and your team’s ability to draw insights fast.
Learn more
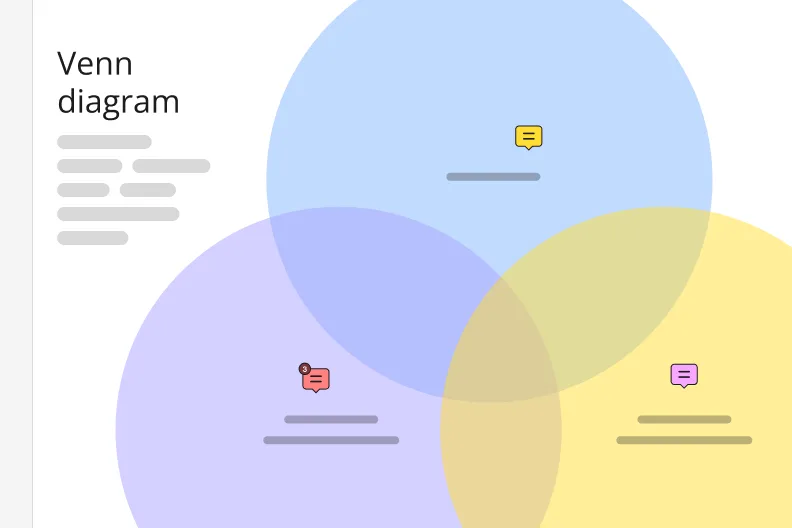
Venn diagram maker
Quickly diagram how your concepts and ideas overlap with Miro’s Venn diagram maker. Show information in the simplest way and run better brainstorms, meetings, and presentations.
Learn more
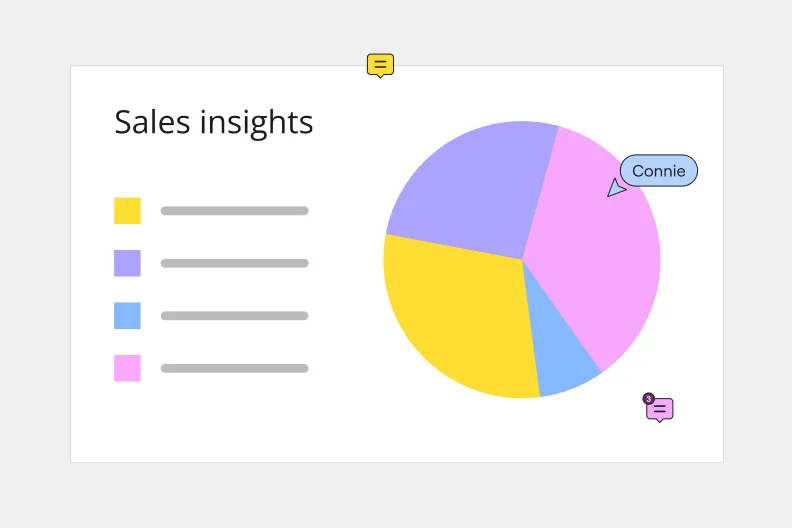
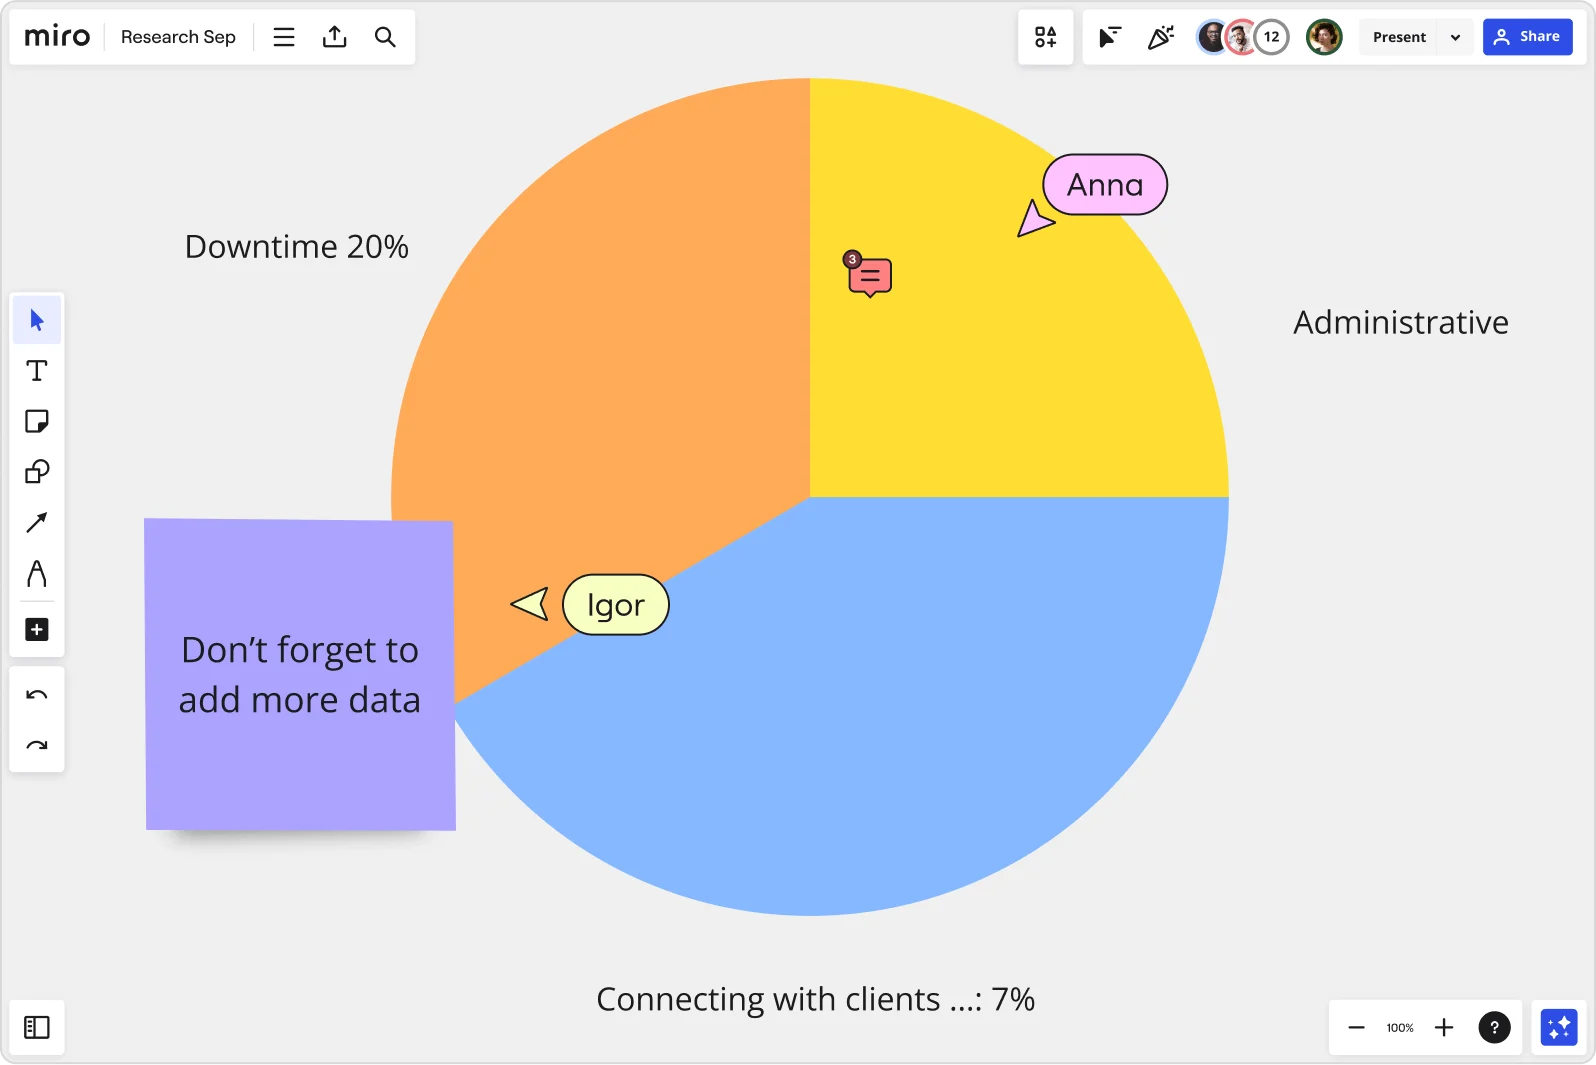
Pie Chart
Pie charts are one of the easiest ways to showcase data, creating a common understanding for teams. Get started in seconds with our free pie chart maker, and make sure everyone is on the same page.
Learn more

Graphic organizer
Use Miro’s graphic organizer maker to master visual storytelling. From strategists to business analysts to educators and teachers, get your point across.
Learn More
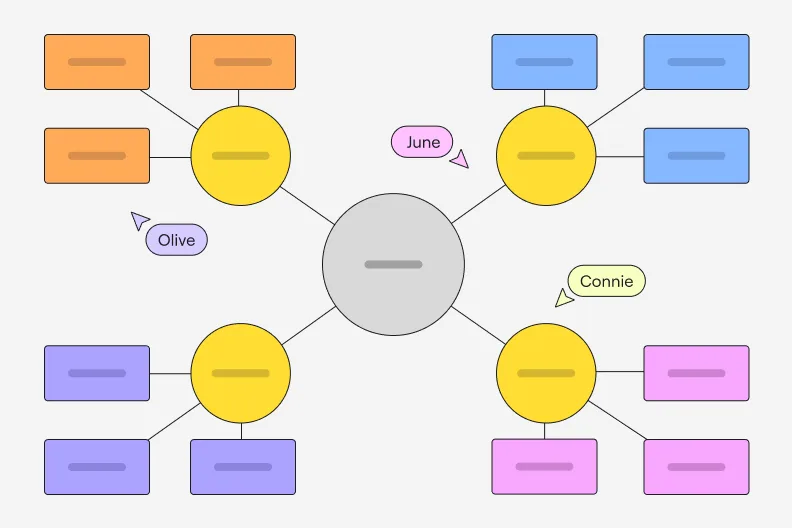
Spider diagram tool
Improve your brainstorming, ideation, and planning sessions with Miro’s spider diagram maker. Elevate your project by organizing concepts in a way that brings clarity to teams.
Learn More
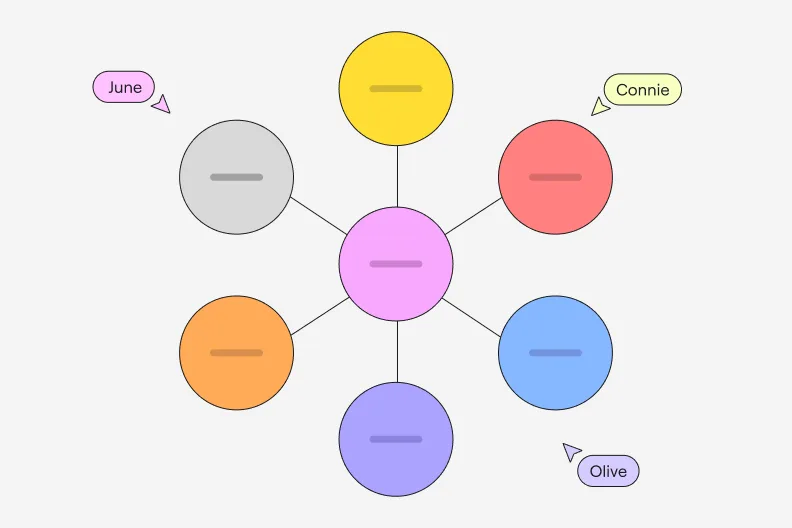
Bubble map
Visualize ideas and how they connect and relate with a bubble map online. Start from a central topic, elaborate, expand, and bring more agility to your brainstorming.
Learn more
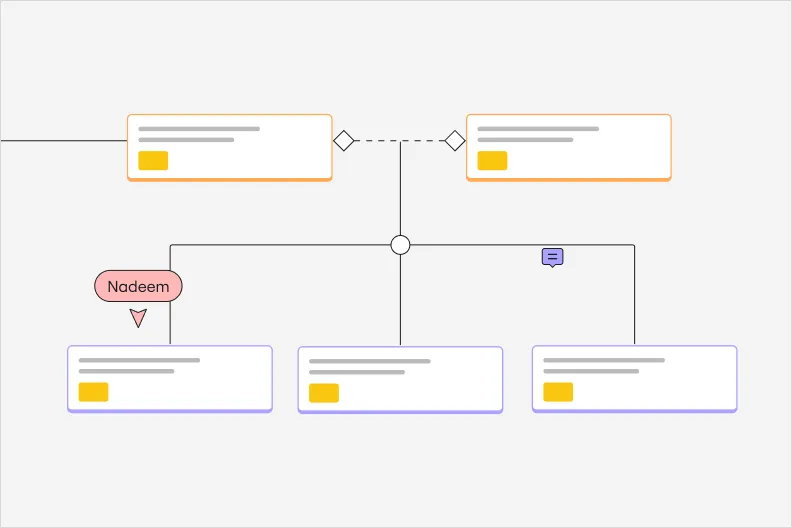
Organizational chart creator
Bring clarity to teams when onboarding new colleagues and reporting roles and relationships with an organizational chart maker. Discover how to visually show information and align teams.
Learn more
How to create graphs with Miro

1
Select the Graph tool
Choose the type of graph you want to create - bar, line, or pie.
2
Add your data
Input your data into the table or import it from a CSV file.
3
Edit your graph
Customize it by adjusting colors, labels, and dates.
4
Share it
Share your graph with your team by inviting them to collaborate or exporting it as an image or PDF.
We have answers to your questions
If you want to create a graph from scratch, use Miro’s Charts app, selecting it in the left toolbar. Choose the chart you want to make and add it to your board. Afterward, adjust your chart's parameters. If you’d like to create a graph using a ready-made template, access our Templates Library.
Yes! Miro allows you to download your graph as a pdf or image so you can print or add it to other presentations and boards.
When creating your chart, maintain consistency and ensure your data are up to date. If you already have a brand style guide, incorporate it into your chart and presentation, and make sure your chart parameters are clear and the way you present your data is aligned with the story you want to tell.
Read more
Read guide
Read blog
Read guide
Get on board in seconds
Join thousands of teams using Miro to do their best work yet.