
Social proof applied to business is an integral part of marketing strategies that leverage the power of persuasion and conformity. The psychology behind social proof is rooted in normative social influence. This type of social influence capitalizes on individuals’ behavioral tendency to be swayed by other people’s actions in order to belong or fit in. Recognizing the impact of social proof on consumers, businesses incorporate the concept of social proofing into their marketing blueprints delivered with the help of marketing software solutions.
But how does social proof work? Furthermore, how effective is it when used to attract more audiences, convert leads, and drive sales? In this article, we have gathered relevant social proof statistics and social proof examples. Through the statistics presented here, we aim to showcase the crucial role social proof plays in your marketing approach.

Social Proof Statistics Table of Contents
Social Proof in Customer Ratings and Reviews Statistics
An ideal example that showcases the power of social proof is in customer ratings and reviews of a product/service or the brand itself. In this section, we will share with you some relevant social proof statistics that illustrate how ratings and reviews can affect a consumer’s purchase decisions and trust in a business or a product.
- 87% of consumers check out reviews of local businesses online. (Murphy, 2020)
- 55% of online shoppers consider customer reviews to be very helpful in their purchase decisions. (Kunst, 2020)
- 66% of potential buyers agree that they will most likely be convinced to purchase a product because of its positive reviews. (Retail TouchPoints, 2020)
- 93% of potential buyers would read online reviews first before deciding to purchase a product or not. (Kaemingk, 2020)
- 91% of consumers between the ages of 18 and 34 trust online reviews as much as they trust personal recommendations. (Murphy, 2020)
- 93.4% of online shoppers rely on customer reviews when researching online retailers they are not familiar with. (Sabanoglu, 2020)
- The trust of 93.7% of digital shoppers in a brand increases because of positive reviews. (eMarketer, 2019)
- 48% of consumers will still consider doing business with a brand that has less than four-star ratings. (Murphy, 2020)
- Website social proof statistics 2021 show that 56% of B2B tech vendors utilize review sites for social proof and customer references. (Liu, 2020; Sullivan-Hasson, 2020)
- 25% of US-based consumers consider shopper reviews as important factors in their decision to whether to trust an online retailer or not. (Statista Research Department, 2021; Retail TouchPoints, 2020)
- 18-24-year-old digital shoppers in the US would trust a product that has more than 200 reviews. (Sabanoglu, 2020; Kats, 2019)
- When caught between two products with a $2 difference, 73% of US-based tech buyers will purchase the pricier product if it has a higher star rating. (Kats, 2019)
Customer ratings and reviews, however, can be a double-edged sword. While overwhelming positive reviews can build your brand’s reputation, negative reviews or no reviews at all decrease the trust of consumers in your brand or product.
- 88.8% of consumers say that their trust in a brand decreases if it has negative reviews. (eMarketer, 2019)
- 81% of online shoppers agree that having no customer reviews makes them lower their trust in a brand. (eMarketer, 2019)
- Meanwhile, 76% of online users in the US are less likely to make any purchase from retailers that do not have any rating. (Kats, 2019)
How businesses handle reviews also leaves an impact on consumers. A customer’s perception of your brand can be recovered depending on how fast their concerns have been addressed and how the issue has been handled. Meanwhile, brands or companies that ignore negative reviews, or worse, remove them from their website, further decrease the trust of their consumers.
- 79.9% of customers admit that their trust in a brand increases when the brand responds to negative reviews or comments. (eMarketer, 2019)
- Meanwhile, the trust of 95% of consumers decreases when brands remove negative comments instead of addressing them. (eMarketer, 2019)
- 20% of customers who submitted their reviews expect to receive a response from the brand or company within the same day. Murphy, 2020)
- The recency of reviews also plays an important factor as 73% of consumers will only go as far as the last month’s reviews. (Murphy, 2020)
- In 2020, 72% of consumers in the US have written a review for a local business. (Murphy, 2020)
Top 10 Industries Whose Reviews Consumers Look at the Most
Restaurants / Cafés: 93
Restaurants / Cafés
%Hotels / B&Bs: 90
Hotels / B&Bs
%Medical / Healthcare: 89
Medical / Healthcare
%Automotive services: 87
Automotive services
%Clothing stores: 87
Clothing stores
%Dentists: 86
Dentists
%Repairs: 86
Repairs
%Grocery stores: 85
Grocery stores
%Hair / Beauty: 85
Hair / Beauty
%Car dealerships: 81
Car dealerships
%Source: BrightLocal: Local Consumer Review Survey 2020
Designed bySocial Proof in Influencer Marketing Statistics
The social proof phenomenon is also evident in influencer marketing. This strategy banks on the relevance of an individual or influencer on digital platforms like social media. Before, the level of relevance was more focused on the number of followers, but recently, the engagement rate and interactions between the influencers and their followers have also been taken into consideration. In this section, we have gathered some of the statistics that look into the most effective influencer marketing approaches, popular influencer platforms, their impact on their audience, and more.
- 10% of B2B marketers agree that influencer marketing is one of the most effective lead generation tactics that produce high ROIs. (Guttmann, 2020; Chief Marketer, 2020)
- When compared to their brand-related content used in other marketing channels, 36% of marketers said that their content delivered with the help of influencers outperforms the rest. (Linqia, 2021)
- 71% of marketers use social media to find an influencer they want to work with. (Mediakix, 2019)
- 81% of marketers said that the most important factor to consider when choosing an influencer to partner with is the quality of content. (Mediakix, 2019)
- Influencer marketing’s market value grew more than twice within a three-year period—from $6.5 billion in 2019 to $13.8 billion in 2021. (Statista Research Department, 2021)
- In 2021, 31% of marketers have at least 10 influencers working on a single campaign—a significant decrease from 62% of marketers who activate the same number of influencers per campaign in 2018. (Linqia, 2021)
- On average, marketers activate 5 to 10 influencers on a single program to reach a broader audience. (Linqia, 2021)
- 86% of marketers reveal that they use shoppable links in their influencer marketing campaigns to drive quick purchases. (Linqia, 2021)
- 65% of respondents agree that their biggest challenge in leveraging influencer marketing is measuring ROI. (Linqia, 2021)
- In terms of budget increase, 71% of marketers said that they will increase their influencer marketing budget in 2021. (Linqia, 2021)
When it comes to the platforms used by influencers, Instagram is still the most popular influencer marketing platform. Furthermore, TikTok is quickly becoming one of the favorite platforms as marketers’ interest in using it increased by 325% in 2021.
- 90% of marketers said they will use their influencer marketing content on paid social platforms. (Linqia, 2020)
- 33% of marketers believe that having content delivered in vertical video is an important part of their influencer marketing strategy. (Linqia, 2020)
- Instagram remains the most preferred platform for influencer marketing with 97% of marketers saying that they will use Instagram the most this year—up from 93% in 2020. (Linqia, 2021)
- 68% of marketers are interested in using TikTok in their influencer marketing campaigns in 2021. (Linqia, 2021)
Contrary to popular belief, the most effective influencers are not celebrities or those with millions of followers. Based on a study by Linqia, marketers are more focused on microinfluencers or those with 5k to 100k followers.
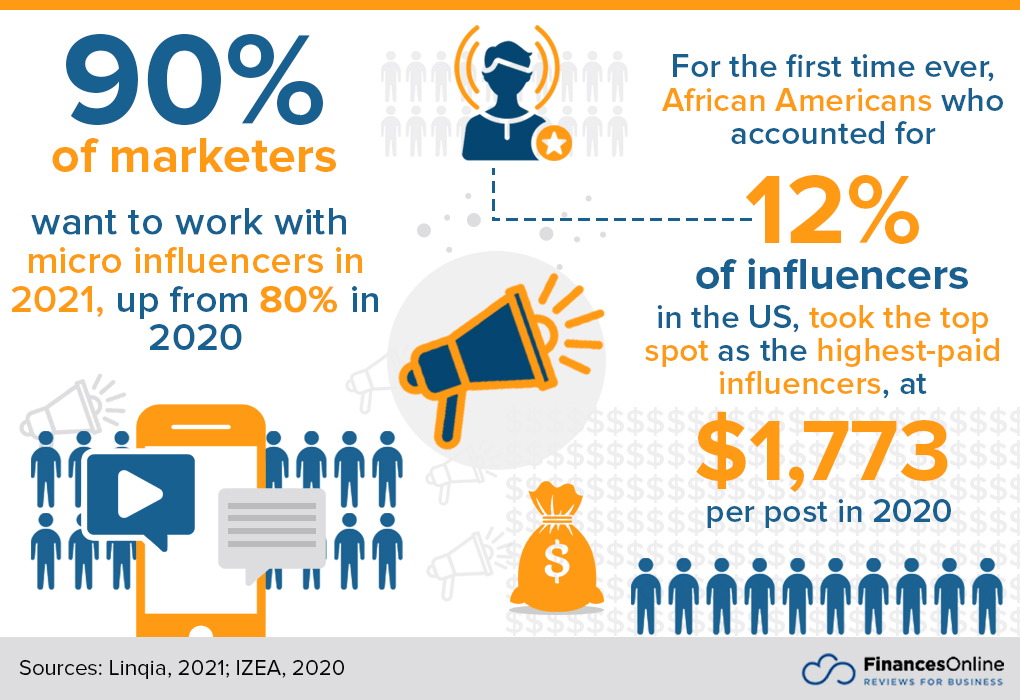
- 90% of marketers said that they want to work with microinfluencers in 2021—up from 80% of marketers in 2020. (Linqia, 2021)
- 45% of microinfluencers’ followers said they have tried the products or services that have been recommended. (Statista Research Department, 2021)
- On the other hand, influencers with more than 1 million followers are capable of convincing 30.6% of their followers to purchase a product or service they are promoting. (Statista Research Department, 2021)
- 71% of marketers agree that the number of engagements (likes, shares, comments) is the best way to determine whether an influencer marketing program is successful or not.
When it comes to the average earnings of influencers, a survey by IZEA reveals that influencer marketing payments vary by race.
- African American influencers earn the most with an average payment of $1,773 per post in 2020.
- Meanwhile, Caucasian influencers have paid the least per post among the ethnicities since 2018.
- Over the past five years, non-Caucasian influencers have gained 12% more market share in terms of sponsorship transaction volume across all special media platforms.
According to IZEA’s survey report, the difference in the payment lies in marketers’ increasing demand for non-Caucasian influencers for a more diverse audience reach.
- For the first time ever, African Americans—who accounted for 12% of influencers in the US–took the top spot as the highest-paid influencers per post in 2020.
- Asians, which made up 6% of the influencer population, fell down the third spot in 2020 after being the top paid influencers in 2019.
- On the other hand, Caucasians, which accounted for 61% of US influencers, have been consistently at the bottom of the list since 2018.
The same study also reveals how the gender, age, and niche of an influencer plays a role in the payments and sponsorships they receive.
- Female influencers receive an average of 87% of all sponsorship deals compared to an average of 11% of sponsorships received by male influencers.
- Male influencers, however, get paid over 50% more than their female counterparts per Instagram photo.
- Influencers aged 17 and younger have the highest average cost across all age groups.
- Influencers who are also professional athletes earned an average of $3,109 per post across all social media platforms.
Social Proof in Social Media Statistics
Social media platforms are among the ideal marketing channels where you can reap the benefits of incorporating social proof. Not only do social media networks constantly expose online consumers to the number of followers and engagements, but a study has also proven that over a third of those surveyed from different parts of the globe believe that social media have positively impacted their lives.
In this section, we will share with you some insights that highlight the value of social media and the latest social media trends in terms of influencing online consumers in their buying decisions.
- 87% of shoppers online believe that social media can help them make purchase decisions (Smart Insights, 2019).
- 30% of online shoppers are more likely to buy from social media platforms such as Facebook, Instagram, Twitter, Snapchat, or Pinterest (BigCommerce, 2020).
- Facebook pages that have 10,000 followers have an engagement rate of 0.45%, which is higher compared to pages with up to 100,000 followers with an average engagement rate of 0.25%. Furthermore, Facebook pages that have more than 100,000 followers only get a 0.08% engagement rate (We Are Social, 2021).
- In the US, 21% of social media users would like posts on a brand or company page; furthermore, 12% would share company posts. (Kunst, 2021)
- 43% of online shoppers learn about new and interesting products from social media networks. (Kunst, 2020)
- 19% of consumers in the US use social media to get more specific information about the products or services they plan to purchase. (Kunst, 2020)
Source: We Are Social, 2021
Impact of COVID-19 on Consumers’ Buying Decisions
The unprecedented crisis brought about by the coronavirus outbreak has also affected how consumers make buying decisions. Consumers have become more cautious, especially when it comes to businesses or brands implementing health and safety protocols.
- The number of consumers who read online reviews of a local business has increased by 6% in 2020. (BrightLocal, 2020)
- 72% of consumers in the US have become more active in writing reviews for local businesses in 2020 compared to only 66% in the year prior. (BrightLocal, 2020)
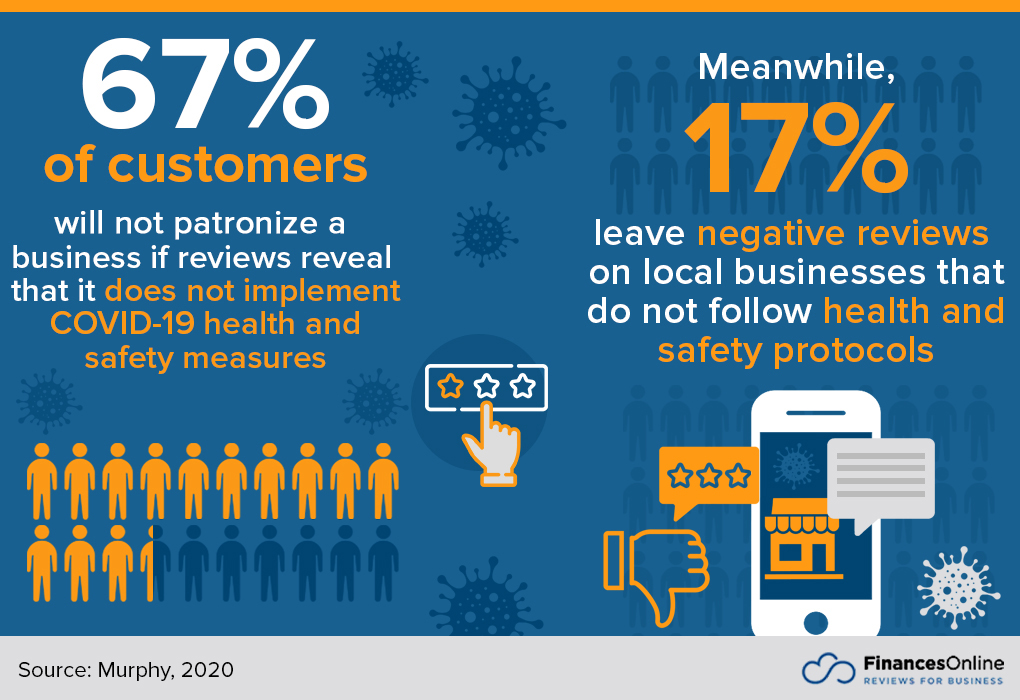
- 67% of customers admit that they will not transact with a business if the reviews reveal that it does not implement COVID-19 health and safety measures. Meanwhile, 17% leave negative reviews on local businesses that do not follow health and safety protocols. (Murphy, 2020)
- On the other hand, 22% of consumers write positive reviews for local businesses struggling to operate in the midst of a pandemic. (Murphy, 2020)
Social Proof Is Here to Stay
Unlike other business and consumer trends, social proof is here to stay. A phenomenon popularized way before the internet became the center of information, social proof has become more empowered by today’s strong digital connection. Leveraging the people’s need for validation, utilizing social proof only has benefits to offer businesses, especially when done right. And with the digital market currently dominating the retail industry, one of the best ways to incorporate social proof in your marketing strategy is by learning more about the latest and compelling online shopping statistics.
References:
- Chief Marketer. (2020). 2020 Chief Marketer B2B outlook. ChiefMarketer.com.
- Guttmann, A. (2020, July 15). B2B lead Gen tactics with highest ROI 2019. Statista. Retrieved April 21, 2021.
- Guttmann, A. (2020, January 22). Influencer marketing – Statistics & facts. Statista. Retrieved April 21, 2021.
- Hutchinson, A. (2021, April 20). New report looks at the most effective influencer marketing approaches, and key platforms of focus. Social Media Today. Retrieved April 22, 2021.
- Kaemingk, D. (2020, October 30). Online reviews statistics to know in 2021. Qualtrics. Retrieved April 21, 2021.
- Kats, R. (2019, February 6). A five-star rating and recommendations from strangers? Take my money. Insider Intelligence. Retrieved April 22, 2021.
- Kats, R. (2019, September 4). Consumer trust relies heavily on reviews and brand honesty. eMarketer. Retrieved April 22, 2021.
- Kunst, A. (2020, November 19). Attitudes towards online shopping in the United States 2020. Statista. Retrieved April 21, 2021.
- Kunst, A. (2020, November 19). Sources of information about products in the United States 2020. Statista. Retrieved April 21, 2021.
- Kunst, A. (2020, November 19). Sources of inspiration for new products in the United States 2020. Statista. Retrieved April 22, 2020.
- Kunst, A. (2021, January 25). Social media activities in the United States 2020. Statista. Retrieved April 22, 2021.
- Linqia. (2020). The state of influencer marketing – Linqia. Linqia.com.
- Linqia. (2021, April 19). The state of influencer marketing 2021 – Linqia. Linqia.com.
- Liu, S. (2020, December 21). Review site uses cases most utilized by business-to-business (B2B) technology vendors worldwide as of 2020. Statista. Retrieved April 22, 2021.
- Mediakix. (2019, May 27). Influencer marketing survey results: 2019 industry benchmarks. Mediakix.com.
- Murphy, R. (2020, December 9). Local consumer review survey 2020. BrightLocal. Retrieved April 21, 2021.
- Retail TouchPoints. (2020, January 30). 2019 shopper insights survey mapping the customer journey: What works — And what’s broken. RetailTouchPoints.com. Retrieved April 21, 2021.
- Sabanoglu, T. (2020, December 1). How many reviews do you expect when looking at a product online? Statista. Retrieved April 22, 2021.
- Sabanoglu, T. (2020, December 1). Most common ways for online shoppers worldwide to research an unfamiliar digital retailer before purchasing as of June 2019. Statista. Retrieved April 22, 2021.
- Statista Research Department. (2021, March 21). Impact of influencer posts on purchasing decisions among influencer marketing audiences worldwide as of February 2018, by influencer tier. Statista. Retrieved April 21, 2021.
- Statista Research Department. (2021, February 10). Influencer marketing market size worldwide from 2016 to 2021. Statista. Retrieved April 21, 2021.
- Statista Research Department. (2021, March 19). When shopping online, what are the most important factors that influence you to shop at a particular retailer? Statista. Retrieved April 22, 2021.
- Sullivan-Hasson, E. (2020, December 21). The new B2B buying process – B2B buying trends for 2021. TrustRadius Blog. Retrieved April 22, 2021.
- Werliin, R. (2020, September 17). New study: Instagram climbs the ladder, TikTok has a long way to go. AudienceProject. Retrieved April 21, 2021.


Leave a comment!